I recently wrote an article about the different kinds of data that we all rack up each and every day of our lives. It was portrayed in an infographic about how much a byte is when put in comparison to the different services we use. It was a staggering look at how the digital industry is changing each day. The further we push technology, the more data will be consumed by every individual each day. It’s not such a hard thing to understand really, but the fact that it’s such a steep curve that is continuing its trend is even more alarming.
We are truly entering a world of total computization when we think about it. If it wasn’t for the advances in storage technology, we wouldn’t be at the place we are today. We’d still be toying away with our 8-bit gadgets thinking they were the coolest thing since the invention of the wheel. However, that’s of course not the reality that we live in, and we’re continuously breaking new ground when it comes to technology, storage and ultimately the compression of data.
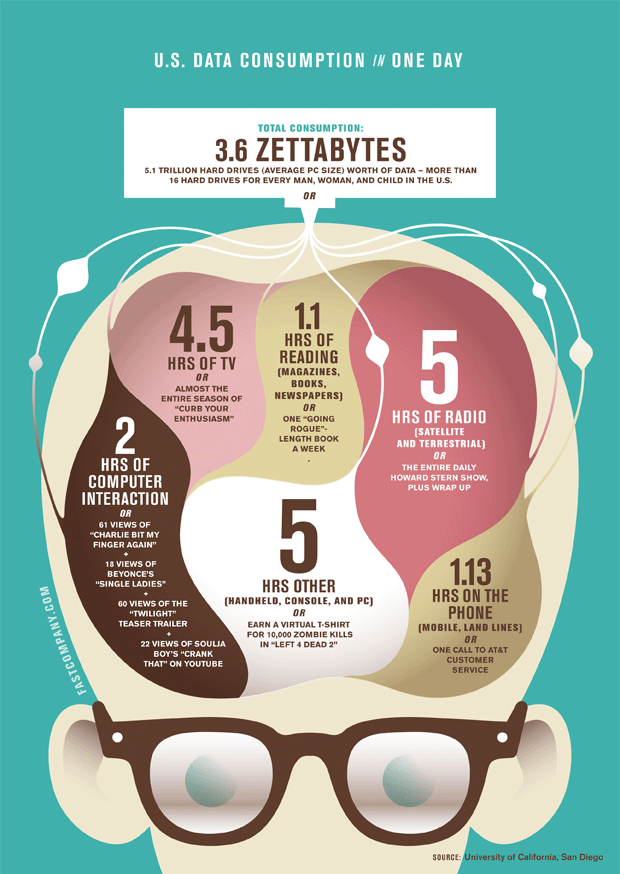
But what is the data consumption per day, at least in the U.S.? There is of course a slew of statistics to take in consideration here, but FastCompany made a valiant effort to try and put this all together, compile it and create something of an understandable infographic to show us all what we might not think about when we turn on that cell phone in the morning.
It’s an infographic that portrays the daily consumption of data broken up into several categories of media interaction. It’s an astounding view of the massive amount of data that has to be stored each and every day. Just to give you a figure, we’re consuming over 3.6 zettabytes a day using our gadgets and information channels. I am not even going to attempt explaining how much that is. Well, that’s 5.1 trillion average computer hard drives filled with data each and every day. Try backing up that!

COMMENTS