You can hardly go on the Internet today without being confronted with the royal wedding that took place yesterday. News reports estimated that there were over 2 billion people watching the ceremony and the partying. That’s almost a third of the entire population of the world. Sure, I had a peek at the wedding every once in a while, and I have to admit, it was quite a wedding. But with 2 billion people watching, I am surprised that the world didn’t stop entirely yesterday. With every statistic that I can find, everything was normal and business carried on as usual. When I think about it, maybe the economy even had a little boost yesterday.
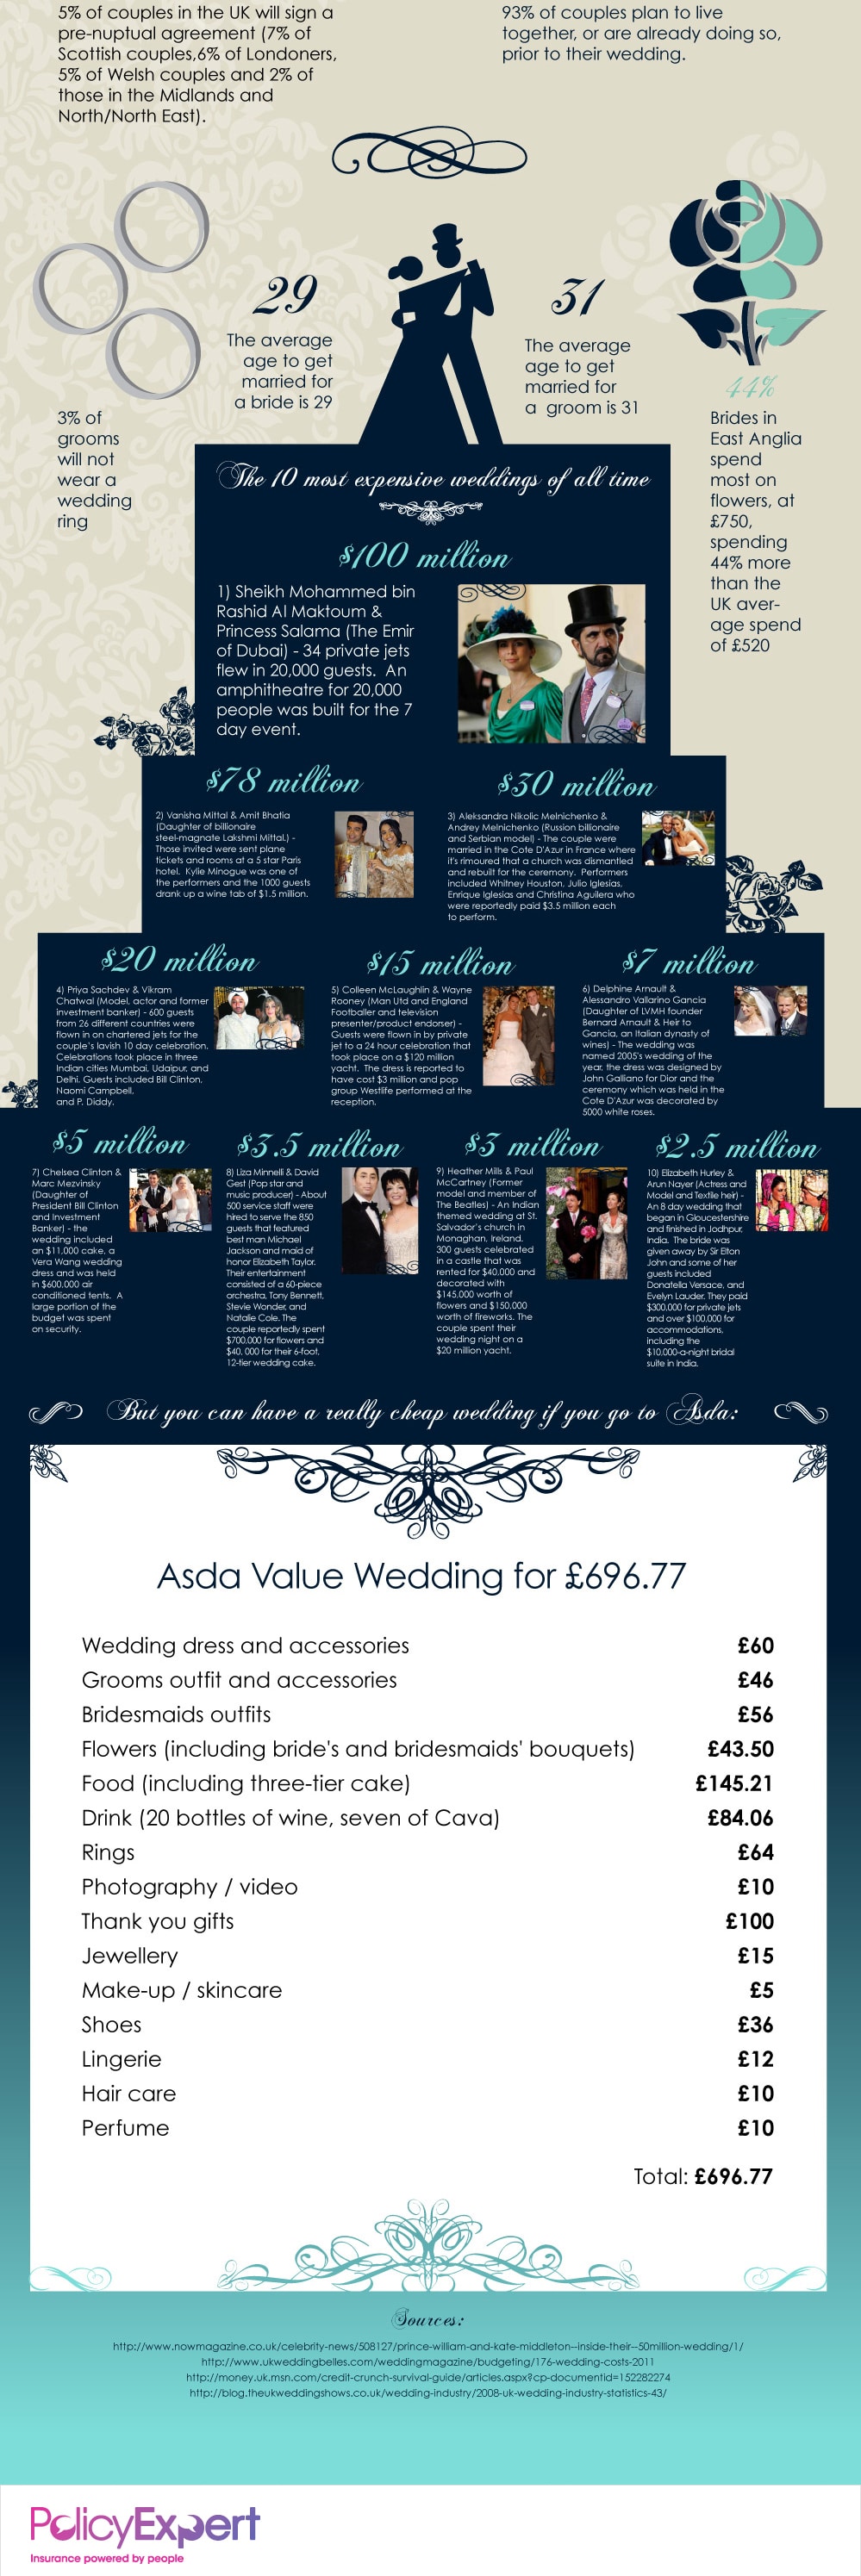
The fact is that many people have tried to estimate what the royal wedding cost, and the numbers being thrown around are quite staggering. There have of course been a number of interesting reports delivered, but what I found most interesting is that pretty much every infographic designer has created an infographic presenting the data based on the cost of the wedding.
In this article, I am not going to just include one infographic since I feel that would not be presenting the whole truth. So, I am going to include three. Each estimate is slightly different, and to get a clearer understanding of the statistics, you can just have a peek at all of these and somewhat bundle them all up. The largest expense was of course security and that post alone stood for around 93% of the cost of the wedding. The rest was spent on the wedding itself, and another 3% was spent on staff. The wedding itself, according to some sources, was the most expensive wedding ever.
Click Images To Enlarge


COMMENTS