I am a frequent YouTube watcher, and I usually indulge in the many commentary gaming videos that are constantly being uploaded to this service. It’s a great way to get the latest info about games and the technology behind them. The commentators are usually really fast, and once a new game is released, they are on top of it finding bugs, new features and rating it for everyone’s pleasure and knowledge. One might think that there are roughly a few hundred games released each year, but that couldn’t be further from the truth. There are actually several thousand games released each year, but they just might not be big budget games. They are most commonly low budget indie games that are released over the Internet, and unless you know where to look, they can be hard to find.
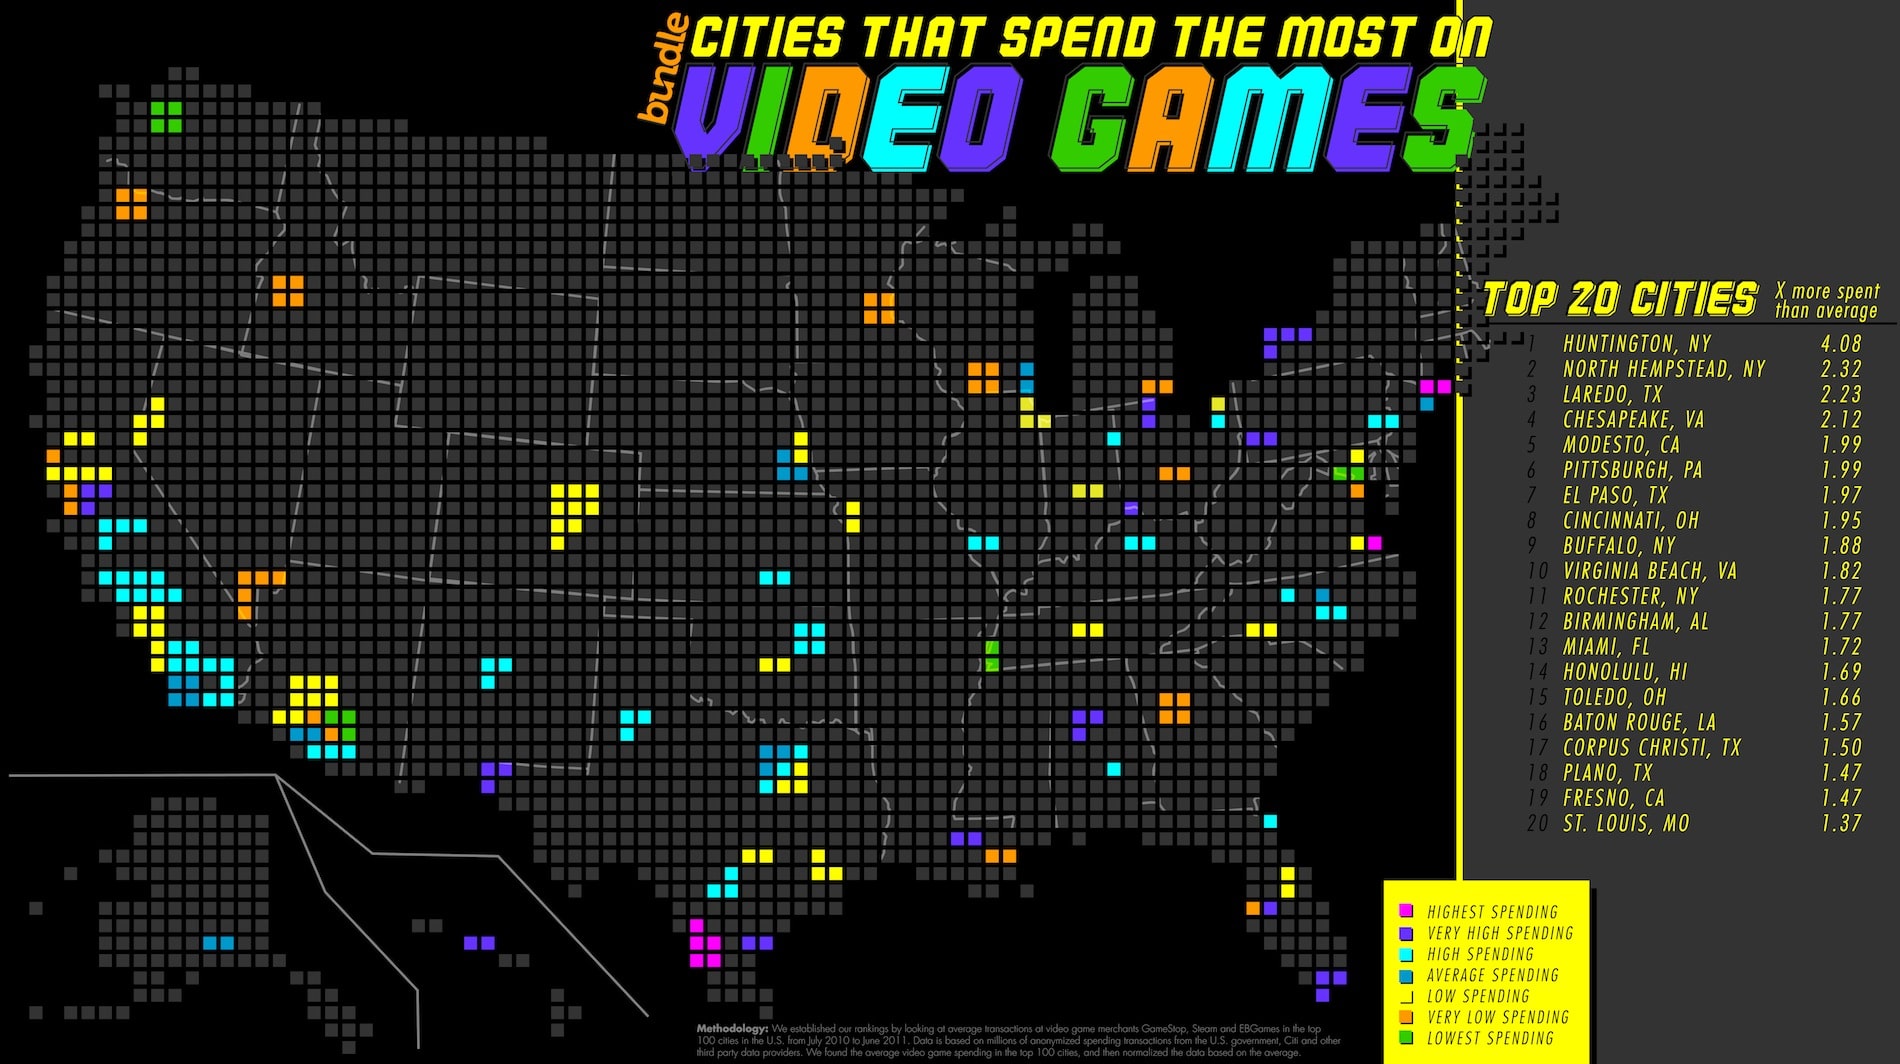
Bundle put together an infographic (or rather a map) of the cities in the U.S. which have the highest spending on games, and they might actually surprise you. With the economy being in a chaotic state at the moment, it’s interesting to see that people are still spending a ton of money on games. However, what’s not included in this infographic is actually that just like music, games are no longer mostly sold in retail stores but in online stores such as Steam and GameStop.
What’s even more interesting is that where the music industry is whining about losses and how the mp3 format has ruined the industry, the game studios are actually cheering on this development. More and more people understand the quality in buying their music and games online instead of downloading them from a shady site somewhere. Not only will they be guaranteed that their game is always available, but they will also sponsor sequels to their favorite games just by clicking and buying online. What could ever be better then that?
Click Infographic To Enlarge

COMMENTS